Circulatory System Health Infographic Template


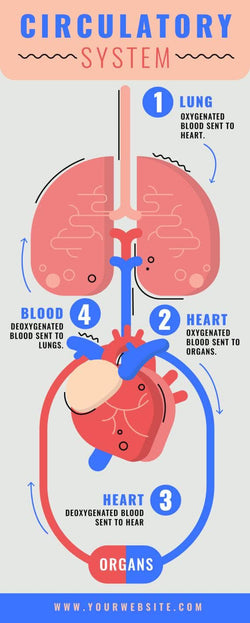
Four numbered steps trace blood between the lungs, the heart and the organs across the circulatory system infographic. A red and blue loop runs from the heart down to a block labeled Organs and back up again.
What's on the infographic
- A Circulatory System title on a peach band, with a wavy line on each side of the word System
- A drawing of the lungs and windpipe above a large heart
- Step 1 Lung and step 2 Heart, each with a short line about oxygenated blood
- Step 3 Heart and step 4 Blood, each with a short line about deoxygenated blood
- A blue footer bar with a placeholder web address in peach letters
As a biology teacher, you can walk your class through it one number at a time. The tall shape fits a phone screen, so your students can scroll it at home.
Read the four printed lines first and keep or reword them to match your lesson. Each step number sits in a blue circle with a short heading beside it, so you can change a heading without moving the drawing. Small arrows show the direction of flow around the loop. Younger students may need a short sentence under each step. Finally, replace the placeholder web address in the footer with your school site or your own name.
Step text, colors and the drawing all open for editing in PowerPoint, Keynote, Google Slides and Illustrator.