Hydroelectric Energy Infographic Template


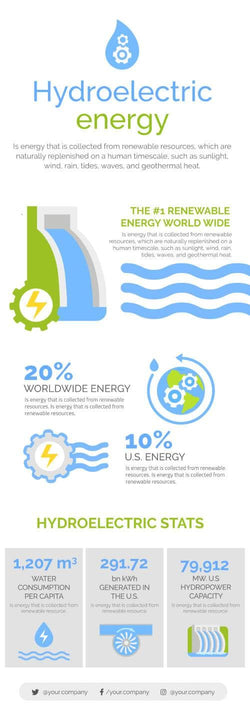
Explain water power on one tall page with the hydroelectric energy infographic. Soft blue and green shapes, gears and waves run down a white background.
What's in the infographic
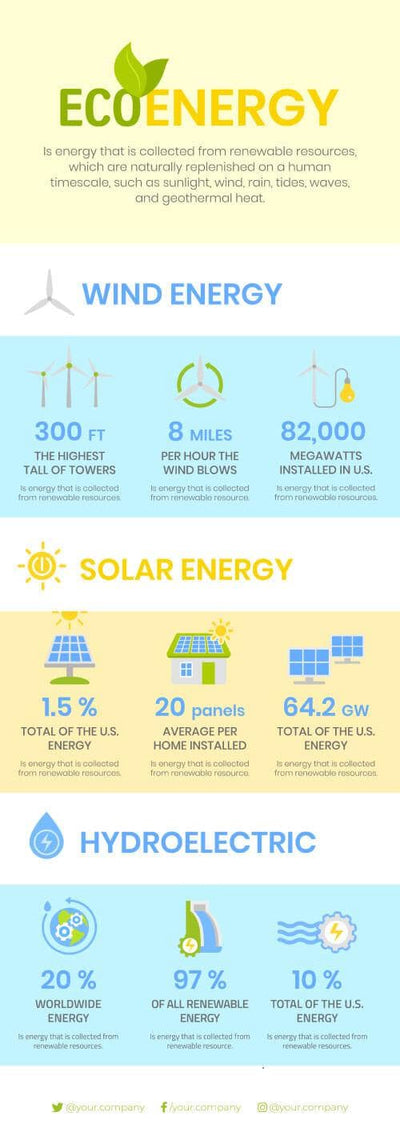
- A water drop icon with gears over a Hydroelectric Energy title
- A dam drawing with a lightning gear beside a headline and a short paragraph
- Two large percentages, one for worldwide energy and one for U.S. energy, each with a globe or gear icon
- A Hydroelectric Stats row of three gray boxes with a figure and an icon each
- A rounded gray footer bar holding three placeholder social handles
You can hand it out in a science unit on power plants, or post it on an energy blog. The tall page reads well on a phone.
The figures are samples, so replace each one with your own before you share the page. The short notes are sample text as well. Start with the paragraph under the title, then the short text beside the dam. Next, put your two big percentages in the middle, each with a short note. The Hydroelectric Stats row at the bottom holds three more numbers. You can change the text and colors in PowerPoint, Keynote, Google Slides or Illustrator, and you can add your handles to the gray footer bar.